Showing posts with label Remote Sensing. Show all posts
Showing posts with label Remote Sensing. Show all posts
Tuesday, 29 April 2014
Thursday, 10 April 2014
APPLICATIONS OF REMOTE SENSING
 |
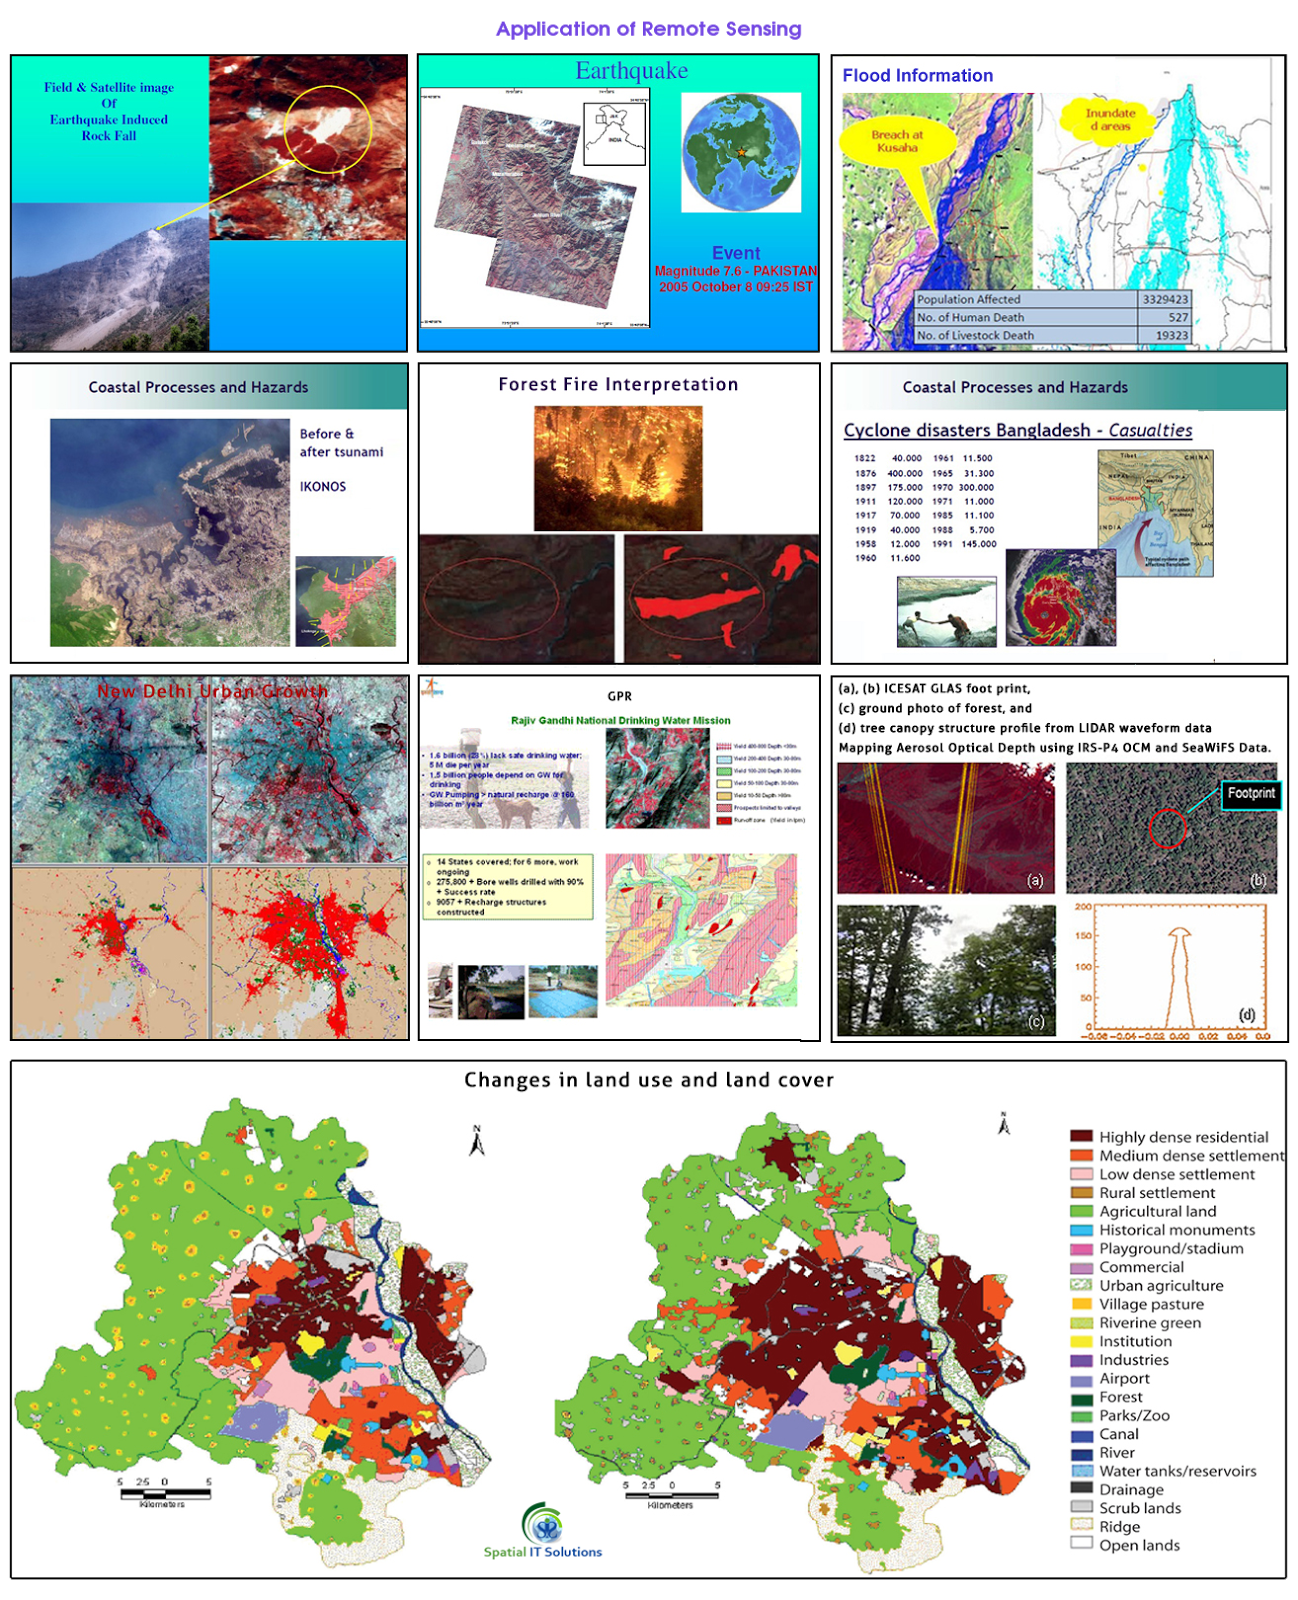
| Application of Remote Sensing |
Remote sensing is a technique to know about the various geographical features of the earth that is in the remote areas. We can know about the object or features without coming in any physical or direct contact with them and this is just because the planet earth and its environment are being observed by the number of satellites that are orbiting around the earth.
There are a large number of things being observed and covered by the satellite and all are of several fields. There are variety of remote sensing applications like climatology, oceanography, agriculture, etc. India has its own satellites Bhaskara, Rohini, Insat, IRS etc.
Some remote sensing applications are:
- Land cover and land use
- Agriculture
- Forestry
- Geology
- Geomorphology
- Hydrology
- Mapping
- Ocean and coastal monitoring
- Monitoring of Atmospheric Constituents
- Land use and land cover- Both land cover and use are different as land use is related to the various activities of human in which way they use the land for ex.-industrial, residencial, recreational etc. Whereas land cover is related to the physical state of the land ex.-forest,grassland,minerals etc.
- Agriculture-Remote sensing application in agriculture helps in identification of crops, its yield, management, condition farming etc.
- Forestry-It helps in monitoring the type of forest, its coverage, exploitation and many other ways application is helpful.
- Geology-The application in geology is helpful in knowing about the earth's crust. It provides knowledge about the landform, structure, composition by physical, chemical and biological changes on and within the surface. We come to know about deposition, bedrock, minerals, soil etc.
- Geomorphology- In geomorphology the remote sensing application tells about the landform and the process that are being used i.e. endogenetic and exogenetic processes. That includes volcanic, plate tectonic, weathering, erosion etc.
- Hydrology-This is the application that gives information about every process that is related with water for ex. water quality,soil moisture, snow,flood,lake etc.
- Mapping-Mapping is related to each and every activity that is being covered by the satellite. The remotely sensed data that are captures are shown on the maps. Through mapping we get to know about the land cover, settlements, types of crop, soil, etc.
- Oceans and coastal monitoring-Ocean application of remote sensing helps identification of the ocean and each and every activity related to oceans like shipping, oil spill, storm, currents etc.
- Monitoring of atmospheric constituent-Remote sensing application of atmospheric constituent includes water vapour,methane,carbon-di-oxide,ozone,etc.
There are endless application of remote sensing that can be used in various fields and process of land, ocean and atmosphere. There are so many applications that proved effective, whereas some are not that effective and so it is being improved by the technology.
More Info: Geospatial Consulting Services
Wednesday, 9 April 2014
Wednesday, 2 April 2014
WHAT IS IMAGE INTERPRETATION?
Image interpretation is related with the identification of remote sensed objects or images and knowing about their significance. To see the useful result of image interpretation the primary tasks are:
- Detection
- Identification
- Measurement
- Problem solving
Detection- It is a primary task to detect or identify an object or feature.
Identification- When a particular target is identified or recognized, for example types of soil, vegetation, forest, rock etc.
Measurement- Measurement is related to the area, length, volume etc. of the targeted objects like forest, rock, water bodies etc.
Problem solving-Image interpretation also involves problem solving that means when an object or the feature is identified an analyst may also be asked to give the complex significances of an image which is sometimes not depicted and so the statement is given as a probability of correction.
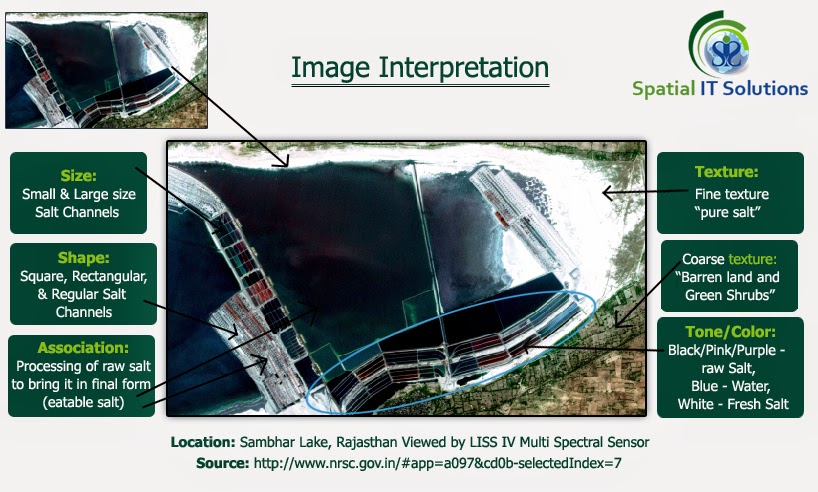
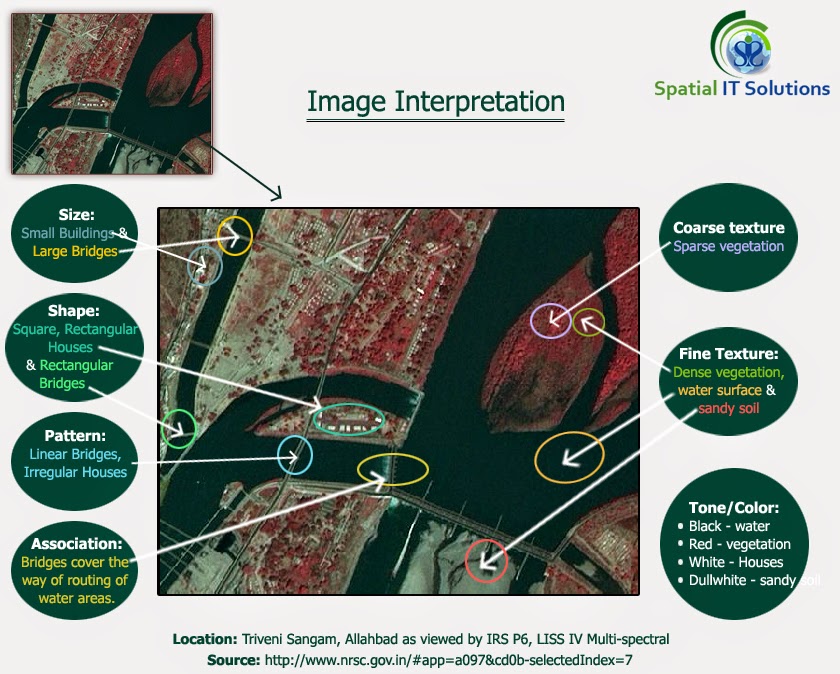
The Attributes on which Interpretation is based are:
- Location
- Size
- Shape
- Shadow
- Tone/colour
- Texture
- Pattern
- Height and depth
- Site/situation
- Association
1.Location- It is related with the position of the object that is global positioning of an object or feature.
2.Size- Size is one of the most important things to know as it tells about the length, breath and perimeter about the feature.It is important to know about the scale. Example sports fields.
3.Shape- The Shape also helps in image interpretation.There are numerous objects on the earth's surface with different shapes and features that helps to interpret.
4.Shadow- Shadow helps in identification of the objects like mountain, building, trees, etc. depending upon the low angle of the sun.
5.Tone/color- Tone refers to the shades of black, white and grey and color refers to the different combination of hue that is blue, green, red which is reflected from vegetation, water, soil etc. An interpreter can interpret through the specific reflected wavelength.
6.Texture- If the tone of different objects is uniform, then the texture helps to interpret the images through smoothness or coarseness.
7.Pattern- Pattern is related with the arrangement of objects, whether natural or man made on the land like settlement pattern, drainage pattern etc. For example some of the patterns are rectangular, triangular, linear, radial etc.
8.Height/depth- It is related with the elevation and is most helpful in detecting the images as it cast shadow depending upon the height and angle of the sun. Buildings and electric poles are the good examples as they are raised from the the ground.
9.Site/Situation/Association - Site here refers to the surroundings or the environment wheather natural or man made, for example regions like slope,hill, plateau, forest, soil etc. Whereas the situation refers to how these are arranged or situated in which manner. For example industries like steel plant industry. Assocition means the common features that is commonly associated with each other. Site, Situation and association mostly work together they are rarely independent. Example a large shopping mall is associated with number of buildings, parking lots, roads etc.
Labels:
IMAGE INTERPRETATION,
Remote Sensing,
What is GIS ?
Location:
Jaipur, Rajasthan, India
Saturday, 22 March 2014
GIS MAPPING TRAINING ONLINE IN INDIA
 |
| GIS MAPPING TRAINING ONLINE IN INDIA |
GIS is a powerful approach towards exploring the world. GIS stands for geographical information system. We all know that there is a need of GIS in almost every field so it plays an important role in govt. As well as in Pvt. Sectors.
Online GIS mapping training in India is a very good opportunity for one and all whether he is a fresher orbit knowledgeable in the field of GIS. Online training provides basic knowledge about the softwares like ArcGIS, GRASS, MapInfo, Quantum GIS is presently known as QGIS that makes it easy to work with GIS and is worth in map making. The online GIS mapping training is a standardized course covering the basic concept of complex material in a simpler form.
It is of great value for the people who are not familiar of GIS and its softwares but has its inheritance in their job. Helps people in map making by displaying geographical information and in many other ways, analyzing, visualizing and solving problems. After developing basic skills regarding the softwares an individual can work on his own or can apply the GIS knowledge in the workplace or organization.
Ques 1. What is online GIS mapping training?
Ans. Online GIS mapping training relates to the e-learning of GIS softwares like ArcGIS, GRASS, QGIS etc. It is an online study that is basic, flexible and easy to learn.
Ques 2. How it is useful?
Ans. It is useful in many ways:
Ans. Online GIS mapping training relates to the e-learning of GIS softwares like ArcGIS, GRASS, QGIS etc. It is an online study that is basic, flexible and easy to learn.
Ques 2. How it is useful?
Ans. It is useful in many ways:
- Saves time
- Easy to learn
- Can be applied in other workplace
Ques 3. In what feilds/streams, it can be used?
Ans. It can be used in both the private and govt. Sectors and in the fields like M.Sc, MA in geography, IT, CS etc.
Ques 4. What are the training centers in India?
Ans. The training centers are:
- GIS Training Institute in India
- Geological Survey of India
- Computer Training Centers Listing from India
- National Indian Programs Training Center
- ESRi
The few training centers are listed above, there are many more GIS training centers that are being run in India.
Thursday, 20 March 2014
What Is Open Source Remote Sensing ?
 |
| Open Source Remote Sensing |
Remote sensing is defined as a technology which provides information about the environment or the phenomenon on the earth's surface which is far away or remotely sensed. A person can get information about the things without any direct as well as physical contact with an object.
Open source remote sensing is a software with a source code which is available for all as a source to learn, to explore and to make use of it. Open sources are the licensed softwares made by many people which are freely available and can be easily used and further modified by anyone for the credits.
SOME SOURCES OF REMOTE SENSING:
IDRISI
Erdas
ENVI
ILWIS
QGIS
Orfeo Toolbox
R
GRASS
SAGA GIS
The above given sources of remote sensing some are free whereas few are not.
ILWI,QGIS for GIS, Orfeo toolbar, R,GRASS,SAGA are some of the free or open sources for remote sensing whereas IDRISI,Erdas,ENVI are not free.
Ques. How open source software is useful?
Ans. It is enourmously useful to the people who even have a little knowledge about this. It is available free of cost with license that means it avoids expense. It can be used by anyone and can also be further modified for the credits.
Ques. What are the objectives of open source?
Ans. There are many objectives like:
- People who are new to this field can gain knowledge about this and is also theoretically beneficial to them.
- Through this open source lectures can be delivered to the students in the lab.
- The changes can be made in the software and can be generated further.
- It can be very helpful for the research scholars to carry out their research in a good and technical manner.
Ques. What are the best open source for remote sensing?
Ans. The best open source for remote sensing are QGIS 2.0.1 "Dufour",GDAL 1.9.2, GRASS GIS 6.4.3,Orfeo Toolbox 3.18, R 3.0.2 and SAGA 2.1.
Ques. What are the microsoft windows in which open source can run?
Ans. Linux, windows, windows Vista, windows Azure, etc are some of the microsoft windows that support open sources and the applications like JAVA and C++ makes the software easily run.
Tuesday, 11 March 2014
HOW TO USE POINT, LINE AND POLYGON IN A MAP?
The word GIS stands for Geographical Information System. It is a technology that gives us information about various things and places on the earth's surface or we can even define it as a technology that is used to view and analyze data from a geographic/ geospatial perspective. Similarly, there is a software known as QGIS previously known as Quantum GIS which helps in making maps or you can say that it plays a major role in the map projection.
The QGIS is very useful for the Thematic maps. The basic files used in creating maps are:
- Raster
- Vector
In raster files, images contain in the form of pixels, or cells, whereas vector files Points, Lines and Polygons for making images.
 |
| HOW TO USE POINT, LINE AND POLYGON IN A MAP? |
- Point: It is used to specify a particular thing or position on the earth's surface, specially used in GPS for the positioning. It is also known as a coordinates that shows the exact location which is very helpful in making maps. The smallest geographical features are well specified by the points where lines and polygons cannot be used. The point is a mark or dot used in the starting and at the end.
- Line: It is used to show the narrow features on the map or you can say the length of the features like road, railway, streams, etc. Lines show the shape and direction which is in more detailed manner that it easier for the users.
- Polygon: It is used to show a particular area or geographical features like a state, particular district, wetland, agriculture, forest, etc. Polygons are the series of nodes that are joined together. The starting and the ending point is the same that means when we draw a polygon we have to end at the same node from where we started.
Thursday, 6 March 2014
DIFFERENT TYPES OF GIS TRAINING COURSES THAT WE RUN
Spatial IT Solutions Pvt. Limited a well established company in Jaipur, India offers different types of GIS training courses under (SISPL). The aim of the training is to generate a proper and good foundation in the field of GIS so to explore more and more challenges with the GIS technology.
GIS Training programs of various courses related with softwares provide basic and grounded knowledge of both the theoretical and practical field.
Our Training Programs:
- To provide basic knowledge and technical skill for good career in the private as well as the government sector.
- To know about the best use of GIS softwares the field of urbanization and management.
- To provide a unique and strong platform for the students to get employed in the universities in the education sector.
- to know about the GIS world and its interaction with the universe.
Topics For The Training:
- GRASS GIS
- QGIS or Quantum GIS
- PostGIS
- ArcGIS
- MapInfo
- spatialite
- MySQL
Other courses beneficial in various streams being offered by the company with well equipped and highly qualified faculty are: Mapping, Network Analysis, Remote Sensing, Digital Image Processing etc.
Monday, 3 March 2014
What in the world is a 'GIS' ?
The word GIS stands for Geographical Information System. It is a technology that gives us information about various things and places on the earth's surface or we can even define it as a technology that is used to view and analyze data from a geographic/ geospatial perspective. It is a powerful approach towards exploring the world. While working with GIS specialized software's are used for input, storage, manipulation/analysis and output/display of geographic (spatial) information, often using maps or other visual displays.
 |
| What in the world is a 'GIS'? |
We can explore the world through GIS as it is used in almost every fields like Oceanography, Climatology, Geology, Archeology, Economics, History, Environment, Engineering, public health etc. GIS plays a vital role in an industries and sectors both in private as well as government sectors. With GIS so used across the disciplines and business sectors, you’ll see GIS as a desired skill for a vast number of positions.
There are colleges and universities offering GIS education programs as it gives a lots of reasons, but not the least of which, it could very well get you with bonus point for career in any field. The educational programs likes "geospatial technology program, Geospatial Revolution project, My Wonderful World".
GIS is best used by the students who are from IT, CS and geography background.
Labels:
GIS Training,
Remote Sensing,
What is GIS ?
Location:
Jaipur, Rajasthan, India
Monday, 9 December 2013
Hyperspectral Remote Sensing
The
advances
in
remote
sensing
and
geographic
information
that
made
the
way
for
the
development
of
Hyperspectral
remote
Sensors.
Imagery
Spectroscopy
is
also
known
as
Hyperspectral
Remote
Sensing
and
it
is
a
new
technology
that
is
presently
being
investigated
by
scientists
and
researchers
and
it
would
deal
with
the
detection
and
identification
of
minerals,
vegetation,
man-made
materials
and
backgrounds.
It
combines
imaging
and
spectroscopy
in
one
system
and
it
often
includes
large
data
sets
and
require
new
processing
methods.
Like
other
spectral
imaging,
Hyper
Spectral
imaging
collects
and
processes
information
from
across
the
electromagnetic
spectrum.
Unlike
the
human
eye
that
can
see
the
visible
light
in
three
bands(red,
blue
&
green),
spectral
imaging
divides
the
spectrum
into
more
bands.
The
technique
of
diving
images
into
bands
that
can
be
extended
beyond
the
visible
region.
Hyperspectral
Remote
Sensing
makes
use
of
Hyperspectral
Sensors.
The
sensors
collect
information
as
a
set
of
images,
where
each
image
represents
a
range
of
electromagnetic
spectrum
and
is
also
called
spectral
band.
All
of
these
images
are
further
collected
and
integrated
to
form
a
three-dimensional
hyperspectral
cube
for
the
purpose
of
processing
and
analysis.
The
precision
of
these
sensors
is
typically
measured
in
spectral
resolution,
which
is
the
width
of
each
band
of
the
spectrum
that
has
been
captured.
It
is
possible
that
the
senors
might
detect
a
large
number
of
fairy
narrow
frequency
bands
giving
the
possibility
to
identify
objects
even
if
they
are
captured
in
a
handful
of
pixels.
Spatial
Resolution
is
a
factor
in
addition
to
Spectral
Resolution.
If
the
pixels
are
sufficiently
large
then
multiple
objects
are
captured
in
the
same
pixel
and
it
becomes
difficult
to
identify
each
of
them.
Also
if
the
pixels
are
too
small,
then
the
energy
that
is
captured
in
each
sensor
cell
is
quite
low
and
the
decreased
signal-to-noise
ratio
reduces
the
reliability
of
measured
features.
The
acquisition
and
refining
of
hyperspectral
images
is
also
referred
to
as
imaging
spectroscopy.
Applications:
There
are
a
few
scenarios
that
make
use
of
Hyperspectral
Remote
Sensing.
- Biomass burning: subpixel temperatures, smoke
- Atmosphere: cloud properties, water vapor, aerosols
- Snow/Ice: snow cover fraction, melting
- Geology: minerals and soil type
- Commercial: agriculture, forest production and mineral exploration
Saturday, 30 November 2013
Thermal Remote Sensing
Thermal
Remote
Sensing
is
described
as
the
acquisition
of
image
data
in
the
infrared
part
of
the
electromagnetic
spectrum.
It
uses
the
radiations
that
are
emitted
by
the
surface itself.
Thermal
infrared
is
emitted
energy
that
is
sensed
digitally.
Thermal
remote
sensing
is
used
on
areas
to
assess
the
heat
island,
to
perform
land
cover
classifications
and
as
an
input
for
models
of
urban
surface
atmosphere
exchange.
Thermal
Remote
Sensing
is
a
special
case
of
reserving
land
surface
temperature
which
varies
in
accordance
to
the
surface
energy
balance.
Thermal data are usually acquired in sequences, where the first image is taken at night and the second is taken during the day. The image that is taken at night is used to monitor the raw emission of the surface and the second image that is taken during the day is used to see what part of incident shortware solar radiation is transformed to thermal radiation and then emitted to the surface.
This
principle
is
used
quite
often
in
geological
applications
and
we
can
study
the
presence
of
different
rocks
based
on
their
thermal
capacity.
Whereas
the
domain
of
visible
and
near
infrared
(VNIR)
radiation
is
suitable
for
monitoring
the
presence
of
metallic
minerals
such
as
hematite,
the
shortwave
infrared
domain
(SWIR)
is
used
for
the
detection
of
minerals
containing
OH-
functional
group.
But
none
of
these
domains
is
suitable
for
observing
the
major
constituents
of
igneous
rocks,
silica
and
feldspar.
In
addition
to
the
geological
applications,
Thermal
Remote
Sensing
image
data
can
be
used
for
:
- Studying the transformation of shortware solar radiation into longware thermal radiation and and evapo transpiration in the case of vegetation.
- Detection of heat loss in buildings
- Detection of the damages of steam pipelines and caliduct
- Detection of the subsurface fires
More Knowledge Contact
:- Spatial
IT Solutions
Subscribe to:
Comments (Atom)


